


The Critical Importance of Data Analytics
In today’s digital business landscape, data has become the most valuable asset for any organization. For e-commerce platforms, sales dashboards serve as the nerve center of business operations, providing crucial insights into every transaction, customer behavior pattern, and market trend. This comprehensive case study examines real e-commerce sales data to demonstrate how data-driven decision making can transform business strategy and drive sustainable growth.
Company Overview
The analyzed company is a technology-focused e-commerce platform specializing in electronics, gadgets, and tech accessories. Operating across nine major U.S. cities, the company maintains a diverse product portfolio ranging from high-end laptops to small accessories, serving a tech-savvy customer base with varying purchasing power and preferences.
Data Collection and Analysis Methodology
Data Sources
-
Transaction Record: Detailed information on every order processed
-
Geographic Data: City-wise sales performance metrics
-
Temporal Data: Monthly and daily sales patterns
-
Product Performance:Individual product sales and pricing data
Key Analysis Areas
-
1. Geographic sales distribution and market penetration
-
2. Temporal sales patterns and seasonality trends
-
3. Product performance and portfolio analysis
-
4. Customer behavior insights and purchasing patterns
Major Findings and
Insights
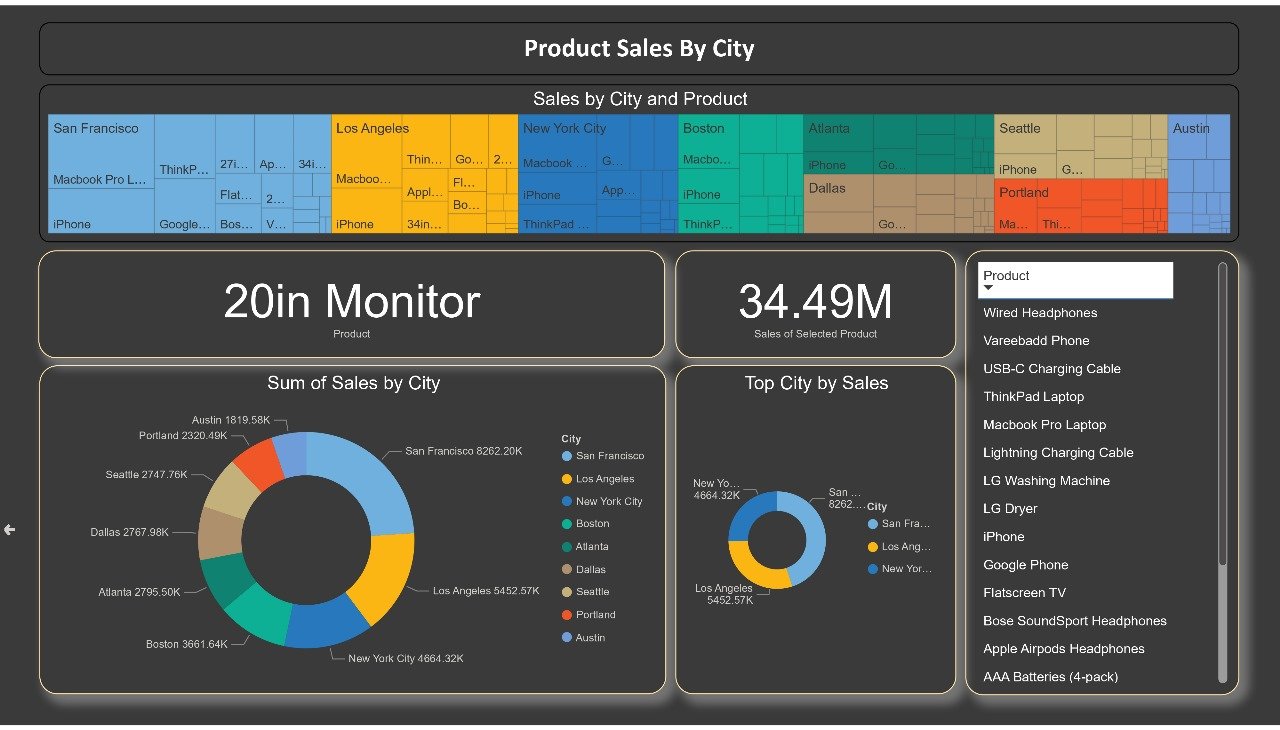
Geographic Sales Performance Analysis
Regional market analysis and expansion opportunities
Top Performing Cities
Strategic Implications
San Francisco's dominance can be attributed to its status as a tech hub with high disposable income and strong demand for premium tech products. The West Coast cities (San Francisco, Los Angeles, Seattle) collectively show stronger performance, indicating regional market preferences and economic factors.
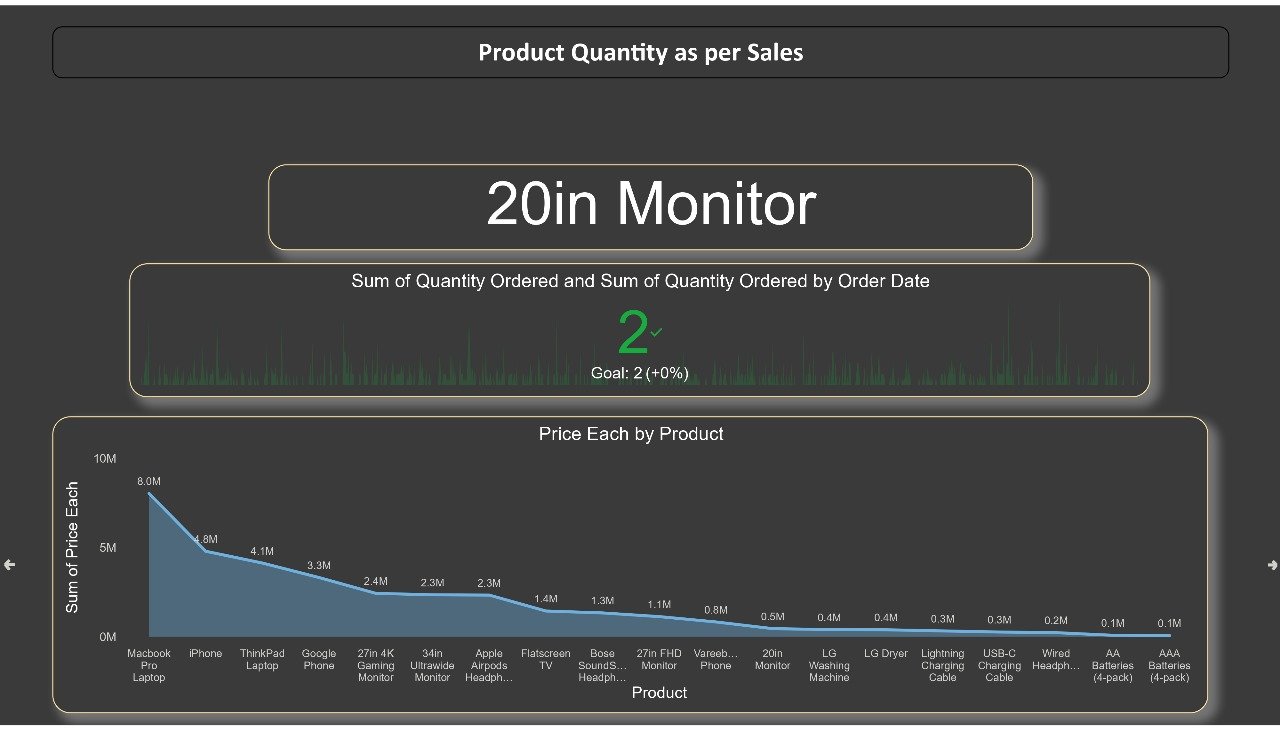
Product Portfolio Performance
Revenue analysis by product category and strategic positioning
Top Performing Cities
Product Category Analysis
1. Laptops dominate with MacBook Pro and ThinkPad leading sales
2. Smartphones maintain strong position with iPhone and Google Phone
3. Gaming accessories show solid performance indicating growing gaming market
Temporal Sales Pattern Analysis
Time-based performance trends and optimization opportunities
Monthly Performance Trends
February
$4.6M
Peak Month
February
$4.6M
Peak Month
February
$4.6M
Peak Month
Major Findings and
Insights
1. Geographic Sales Performance Analysis
Top Performing Cities
- San Francisco: $8.26M (Market leader)
- Los Angeles: $5.45M
- New York City: $4.66M
- Boston: $3.66M
- Atlanta: $2.80M
Strategic Insight: San Francisco dominates due to its tech hub status and high disposable income. West Coast cities collectively outperform others.
2. Temporal Sales Pattern Analysis
Monthly Performance Trends
- Peak Month: February ($4.6M) – Post-holiday surge
- Strong Performer: May ($3.7M) – Spring refresh
- Lowest Month: January ($1.8M) – Spending fatigue
Daily Time Analysis
- Afternoon Peak: $12.53M (36.8%)
- Evening Strong: $11.74M (34.1%)
- Morning Moderate: $8.27M (24.2%)
3. Product Portfolio Performance
Top 5 Revenue Generators
- MacBook Pro Laptop – $8.04M
- iPhone – $4.79M
- ThinkPad Laptop – $4.13M
- Google Phone – $3.32M
- 27" 4K Gaming Monitor – $2.44M
Analysis: Laptops lead sales, smartphones maintain strong position, and gaming accessories show promising growth.
4. Challenges & Strategic Solutions
Key Challenges
- Geographic market imbalance
- Seasonal revenue volatility
- Product concentration risk
- Competition pressure in premium segments
Strategic Solutions
- Market Penetration: Partnerships, community engagement, regional campaigns
- Product Diversification: Smart home devices, wearables, private labels
- Customer Retention: Loyalty programs, subscriptions, user communities
5. Return on Investment (ROI) Analysis
Current Metrics: $34.5M revenue, Top 5 products = 60%, Top 3 cities = 53%, Peak hours = 71%.
Projected Improvements: 20–25% revenue growth, 15% CAC reduction, 30% CLV increase, 18% efficiency gain.
6. Strategic Takeaways
- Geographic intelligence drives expansion
- Temporal optimization boosts efficiency
- Diversified portfolio reduces risk
- Customer-centric approach ensures sustainability
Final Recommendation
Companies must treat data analytics as a core business capability, not a support function. Investment in infrastructure, skilled personnel, and systematic processes ensures long-term growth, risk reduction, and market advantage.
The future belongs to organizations that can harness data to innovate, optimize operations, and deliver exceptional customer experiences.